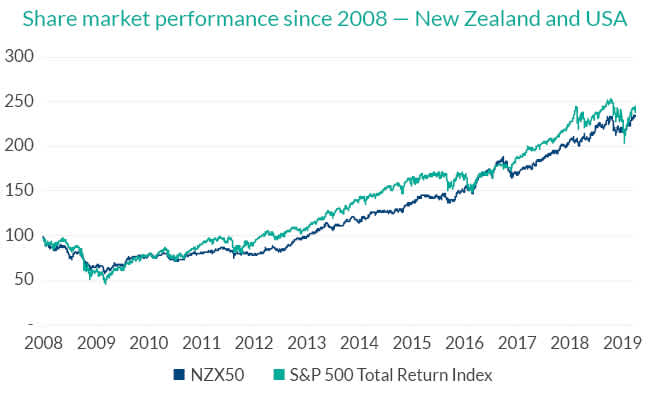
10 years ago global share markets hit rock bottom. In March 2009, the US share market had more than halved from its peak and the New Zealand market had fallen more than 40%. With the benefit of hindsight we now know the global financial crisis provided a phenomenal investment opportunity for brave investors and has been a boon for savvy KiwiSaver members (particularly those in a growth fund). But just how good has the last 10 years been in financial markets, how does this compare to previous decades, and what might the future hold?

I can still remember March 2009 vividly. The press was full of headlines about banks on the brink of collapse (I was working for one of them at the time), economic growth was stalling and job losses were starting to mount. That month the US S&P Index hit its lowest point during the financial crisis - 58% off its highs. For those that had the courage to be buying at that time, the US share market has gone on to deliver a return of over 400% since then. New Zealand’s NZX50 Index is up more than 280% over the same period. By comparison, property prices in Auckland are up 95% over the same period. So it has clearly been a great run for the share market.
All of this is nice history, but you could rightly ask what this means for future returns? Whenever markets have had a strong run like we have experienced there will be articles warning that peril looms, and that investors should rush to put their hard-earned savings under the mattress. We have seen this in the last four weeks with countless articles in the financial newswires suggesting we could be near the end of this bull market run.
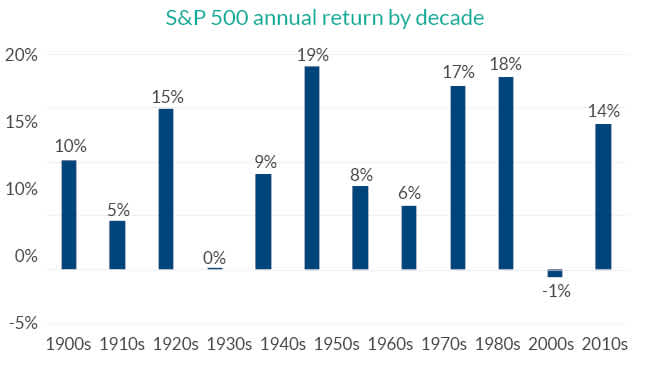
Rather than speculate about what the future may hold, I decided to dig out some very long-term data and look at US share market returns going back to 1900. The chart below shows that the decade so far (2010-2019) has seen slightly above average annual returns (14% pa) compared with prior decades. While it has been one of the better stretches in history, the decade did start after the worst decade in history (from the peak of the dotcom bubble in 2000 to the depths of the global financial crisis) and returns have been lower than we witnessed in the 1980s and 1990s.

More importantly, the chart highlights three key things. Firstly, share market returns come in fits and starts. There have been many periods of strong returns, but markets are volatile and there are also long stretches with low returns. Secondly, if you hang in there for the long term, returns can be very attractive and over this whole period the US market has delivered an average return of 9.7% per annum. Thirdly, with a long investment horizon the risk of loss in the share market is lower than many would suspect. In no decade over the last 120 years would investors have lost a significant amount of money if they stayed invested for the full 10-year period.
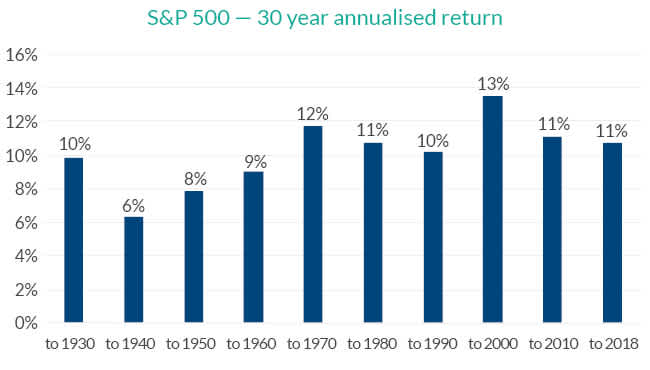
Just for fun, I extended the timeframe of the above analysis. If you run the same chart for rolling 30 year periods, the period many people will save for retirement, the analysis is even more compelling. Not only are there no 30 year periods when the US market has lost money, there are no periods when buy and hold investors would have earned a return of less than 6.3% per annum. Said another way, over the worst 30 year period in US market history, $10,000 invested on day one would have been worth over $60,000 after 30 years of compound returns.

Money invested in the share market grows over the long run for a reason. The share market isn’t just a squiggly line on a computer screen, it represents the collective value of many of the world’s most successful businesses. These businesses generate cash flow that they either return to shareholders or reinvest to grow. They benefit from a growing economy as new technologies are developed, workers become more productive, living standards increase and the global population grows. It isn’t hard to see the prosperity we have witnessed globally over the last 30 years and the level of poverty globally has more than halved. Patient investors can expect to benefit from the next 30 years of prosperity, as emerging markets continue to develop, and technology like robotics, artificial intelligence and driverless vehicles improve productivity, drive growth and lift living standards.
None of this is to say that returns will be as good as we have witnessed in recent years. In fact, I doubt they will. But equities should continue to deliver good outcomes for patient investors that aim to build wealth over the long term.

